5 Case Study: Finding Early Modern Marginalia
5.1 Understanding Big Data
When regarding collections as data, I have discussed the challenges faced relating to metadata, but what about the issues encountered when using collections as data in their entirety? Machine learning models require large-scale data for training, fine-tuning, and evaluation. In the context of cultural heritage institutions, creating such large-scale datasets carries legal and logistical implications, not to mention the further challenge of having trained historians conversant in the techniques.79 These compounding factors have so far slowed the potential of machine learning models for historical inquiry. Existing digitised cultural heritage collections can help bridge this gap; however, this requires that the institutions which hold this data be active participants in this shift to making their digitised collections open and accessible to use in ways other than simply viewing.
Although cultural heritage institutions are increasingly digitizing their collections and making them available through online portals for public consumption and discovery, the usability of their collections as data is rarely straightforward. Application Programming Interfaces (APIs), virtual bridges which enable applications to send and exchange data or functionality, are becoming more standardized and prevalent within digital collections. Many APIs lack comprehensive documentation on their usage beyond internal data retrieval, although large museums with more resources to allocate to digitisation are working towards developing relevant documentation or usage guides. The Victoria and Albert Museum (V&A) Collections API was one of the first to be made open to researchers, with development beginning in 2009; it is an excellent model of what documentation should look like, with detailed written guides alongside sample code and additional resources for their anticipated users.80 Yet even the V&A is not exempt from one of the pitfalls which APIs of large collections face; they tend to end up being prescriptive and restrictive, particularly when it comes to allowing a user to download the entirety of the available digitised collections. The V&A API is not recommended for bulk data export, and other institutions such as the Getty do not provide a way to get a list of all of the objects or a way to download all the data in the collection at all.81 While APIs offer a more formal way of accessing collections as data, many of those who seek to use collections as data find “simple download dumps” more useful to quickly explore what is a collection offers. Downloading a file containing the data provides direct access without the barrier of having to learn the intricacies of an API.82 Yet even when cultural heritage institutions do offer their data as downloadable content, it often ends up being in complex schema formats like METS, MODS, and ALTO XML. While these formats are standard in the library and archival domains, they pose a barrier for use in contexts of data analysis where formats such as CSV and JSON files are preferred due to the availability of programming libraries that can easily process them.
As discussed in the context of metadata, the lack of attention paid to the curation of training data in machine learning has been a significant topic of discussion as of recent, with research emerging from the field of computer science on recommendations for ethically sound and transparent standards for publishing datasets alongside calls for more “accountable” curation, as is perceived to be practiced in cultural heritage institutions. These discussions have fed into reflective research within archival studies on what ethical issues may arise when using cultural heritage data for the purpose of machine learning. Collections, in both digital and analogue form, are not just sources of history but also “its subjects, sites with histories and politics of their own.”83 Without critical reflection on how collections have been curated in past and present, or what has and has not been digitised, there is risk of models trained on cultural heritage collections to exclude entire histories if careful attention is not paid to the composition of a collection. Conversely, there is also risk of including items in the data that are by-products of colonial and exploitative histories of the archive, featuring vulnerable people who may not have chosen to have their presence be displayed in this context. Even with good intentions, projects using cultural heritage data “risk kitschifying or exploiting those represented in the digitised collections in question.”84
A recent demonstration of contested subjects and vulnerable histories within digital archives is the Zealy Daguerreotypes, a series of photographs taken by Joseph T. Zealy featuring enslaved men and women in various states of undress commissioned by naturalist Louis Agassiz in 1850 as part of his effort to document physical evidence of polygenism, the theory that different racial groups do not share a common biological origin.85 These daguerreotypes were uncovered in the attic of Harvard University’s Peabody Museum of Archaeology and Ethnology by an archivist in 1977, and are now featured in the Peabody Museum’s online collections, being, in fact, the first of the search results for “daguerreotype”.86 Tamara Lanier, a descendant of two of Agassiz’s “subjects”, sued Harvard in 2019 for unlawfully possessing and profiting from the image of her ancestors, who as slaves could not have consented to these photos being taken and their further usage.87 Despite the contention surrounding these images, when viewing their entries within the digital archive there is no indication of the history associated with these photos in the metadata, no context given about the enslaved subjects or the fact the photographed individuals were enslaved, nor the photos’ purpose as “proof” of polygenesis by Agassiz. There is only a short disclaimer about historical language, which appears to be present on all items in the Peabody Museum’s online collections. These individuals are not safe from being commodified again; as images in the public domain, they could easily end up in scraped into a dataset and used for the purpose of machine learning. For instance, following the controversy surrounding Stable Diffusion’s questionable outputs, technologist Andy Baio and Datasette creator Simon Willison produced a searchable data browser for a sample of approximately 12 million images used in the training of Stable Diffusion.88 This is about 2% of the 600 million images used to train the most recent update of the model, and only 0.5% of the 2.3 billion images that it was first trained on, yet when searching the word “daguerreotype”, a picture of a woman with her enslaved child servant feature more than once.89
In both an effort to keep this case study accountable as a project which uses cultural heritage collections as data for machine learning, and as a demonstration of how standardized guidelines can be implemented and beneficial to research, the remainder of this section will follow the “Collections as ML Data” checklist for machine learning and cultural heritage recently developed by Benjamin Lee.90 Observing the growing trend in the field of machine learning to develop guidelines, checklists, and best practices for researchers and practitioners involved in creating datasets, training models, and implementing machine learning systems, Lee proposes the creation of his “Collections as ML Data” checklist. This checklist is intended to help researchers working on machine learning projects involving cultural heritage collections through addressing potential challenges such as misrepresentation, oversimplification of digitisation nuances affecting model performance, unnecessary use of machine learning, lack of sustainability planning, and privacy violations. By incorporating this checklist into their projects, researchers can engage more thoughtfully with these challenges and enhance their impact on the field of digital cultural heritage.91 Lee’s article draws from both machine learning and cultural heritage research, creating an interdisciplinary tool for responsible data practices.92
5.2 The Cultural Heritage Collection as Data
There is a distinction between the cultural heritage collection being studies, and the training dataset from which a machine learning model is created reflecting that collection.93 In this case study, I use machine learning to train an object detection model to identify marginalia on pages of the National Library of Scotland’s (NLS) collection of chapbooks; such a trained model could be used further on other early modern texts emerging from a similar context as the chapbooks. In order to create the training data necessary to teach the model what marginalia looks like, I drew from three cultural heritage collections which contained annotated texts created largely during the early modern period, with the oldest printed in the late 15th century and the occasional chapbook being from the 19th century. Pages from the latter date range were not used in the training data, but due to the parsimonious and cyclical nature of chapbooks their appearance differed only slightly if at all from chapbooks printed in earlier centuries.
My interest in these texts was spurred by a previous project that was meant to identify the woodcut illustrations scattered within them; instead, alongside illustrations the detector would also pick up marginalia. Since the ultimate goal for this case study is to intentionally identify marginalia in this collection of chapbooks, I chose to incorporate these pages I had made note of that were outputted by the illustration detector into the training data for both diversity and to provide domain specific examples in hopes of improving the trained model’s performance. The second digital archive drawn upon is Archaeology of Reading project which was a collaborative effort between the Sheridan Libraries, Centre for Editing Lives and Letters, and Princeton University library that resulted in a corpus of thirty-six fully digitised versions of early printed books annotated by “two of the most dedicated readers of the early modern period: John Dee and Gabriel Harvey”.94 Considering himself a scholar of science, the marginalia composed by Dee feature tables, charts, and diagrams to make sense of what he read. In contrast, Harvey was a humanist and approached his selection of reading as such with passages highlighted through underlining and notes connecting the text to other works read. Finally, to further increase the variety of marginalia that the model will learn from, I drew upon a collection of Early Modern annotated books compiled by the William Andrews Clark Memorial Library at the University of California, Los Angeles which spans from the 15th century up until the early 19th century as the early modern period came to a definitive close. The marginalia in this collection are the most diverse of these sources, containing the scrawl of not only scholars, but printers and other members of the community as well.
5.2.1 NLS Chapbooks in the Data Foundry
To ensure a complete understanding of what each collection offers researchers as both a subject to be studied and as data, we will interrogate each more deeply than just description, beginning with the NLS’s chapbooks. NLS Chapbook collection finds its origins within the Lauriston Castle Collection. This collection is a subset of the larger library established by William Robert Reid, a prosperous Edinburgh businessman who acquired Lauriston Castle in 1902.95 Reid had been assisted in his book collecting by a family friend, John A Fairley, author of several articles on the bibliography of chapbooks. During the course of his research Fairley had formed a collection of chapbooks containing around 500 volumes comprising over 5,500 items, which are now also part of the collection. The chapbooks are organised according to the town where they were printed, with the assortment mainly consisting of Scottish chapbooks, but English and Irish volumes also contribute to its diversity.
The NLS’s Digital Scholarship Service is responsible for curating the digitised chapbook dataset which, along with other machine-readable data collections, is made available through the NLS’s Data Foundry platform. While specific funding information is not provided, the NLS’s Data Foundry operates as a permanent branch of the library, indicating that the resources were drawn from the library’s overall budget rather than secured through separate funding endeavors. Further, the item-level data that is viewable after downloading the dataset from the Data Foundry platform explicitly states that, “NLS chapbook’s digital form was curated as part of Library activities to make more Scottish collections available online, and chapbooks were selected for this task due to ease as all volumes are the same size.”96
Although the collection process is not outlined in detail in the context of digitization, the NLS do offer information about how the chapbooks which were digitised were acquired. The Lauriston Castle Collection was bequeathed to the library in 1926 by Mr and Mrs Reid, following the latter’s death that year. This bequest also included the Reid Fund, consisting of £70,000 (the income from the estate of Mr and Mrs Reid) which subsequently enabled the Library to acquire printed and manuscript items to add to the national collections.97 To judge from the date stamp included in the Data Foundry’s listing for the chapbook collection, the digitisation process presumably concluded in 2019. However, in the item-level data, it states that the chapbooks were captured as part of a project to digitise such materials beginning in 2015. The item-level data further reveals that each page of the chapbooks was captured using a Nikon D800E DSLR camera in the NLS’s Causewayside studio by Picturae, a digitisation service provider. It is stated that transcriptions associated with each resulting image file were generated from optical character recognition (OCR) performed by the National Library of Scotland. There are many different algorithms and software packages for performing OCR, but when we look more deeply at the item-level data, the images for each book were combined into a PDF format using a Luratech PDF application which has integrated OCR technology to make the PDFs searchable. In the page-level data, it is stated that pdfalto, a command line tool for parsing PDF files and producing structured XML representations of the PDF content in ALTO format, was used to breakdown the OCR output further.
Despite the straightforward reasoning provided surrounding the NLS’s motivations for digitizing the chapbooks and the transparency of the digitisation process itself, what remains missing from the process of collection and curation is a question of who. The specific individuals responsible for collection and curation decisions are not documented. The identity of those who selected the items for digitisation is undisclosed. Additionally, information regarding the original ownership of the chapbooks before Fairley, the cataloging processes pre- and post-digitization, and the individuals involved in transforming the chapbooks into their current digital form within the NLS’s Data Foundry remains missing from the available information.
5.2.2 The Archaeology of Reading
As touched upon earlier, AoR was created as a collaborative research endeavor to consolidate an exemplary portion of the marginalia produced by Gabriel Harvey and John Dee. The assembly of AoR began in November 2015 and was completed in January 2019, with its research and development being conducted with major funding from the Andrew W. Mellon Foundation. The books which make up AoR were selected and annotated by a collective of researchers at the Sheridan Libraries, Centre for Editing Lives and Letters, and Princeton University library, however, the lead researchers Earle Havens, Anthony Grafton, and Lisa Jardine likely had the strongest curatorial role. The largest gap within the AoR collection is that they do not cover what technology was used to capture their texts, although they do indicate that the digitisation of the books was done primarily in situ by the repositories who held the physical copies themselves, or through a contract with UCL Digital Media. Further, they indicated that they required the images to have a resolution of 600 DPI which implies a DSLR camera like that used by the NLS. While they do not discuess what tools were use specifically, possibly because they themselves did not know due to the geographic expanse of their project, out of all digital collections used for this project, AoR provides the most extensive and transparent description of their collection process, largely in the form of a detailed article on how to “do” AoR yourself, that is, how to replicate their work using a researcher’s own corpus, by closely explaining their own process.98
AoR is also the most prolific when it comes to discussing the curation of their collection, with dedicated essays on the libraries of Harvey and Dee. Although it is thought that Harvey’s library once contained up to 4000 books, following his death it was dispersed with his books scattered in private, public, and academic libraries around the world.99 So, the selection of which of his books to digitised for the AoR project was in large part a practical endeavour; the first books chosen were the nine in the possession of the Princeton University Library, one of their partnering institutions. In addition, these nine books, other titles were added to the Harvey AoR corpus often based on factors such as availability (does the binding allow for the book to be digitised?) and the affordability of digitisation within a given repository. The Princeton books alone did not form thematic unity, as much as they reflected Harvey’s intellectual interests in topics of warfare, (Roman) history, law, political economy (i.e., husbandry), and linguistics. However, the inclusion of five other titles alongside those at Princeton allowed for the expansion of the topics and the formation of “clusters” of books: books which thematically overlap, and which may have been read in conjunction with one another, as Harvey enjoyed doing.
While Dee’s library was also dispersed posthumously, and in part, prior to his death due to financial troubles, he created a detailed catalogue of his books at numerous points in his life, which made his pursuits much more easily traceable.100 Like when constructing Harvey’s AoR corpus, factors such as the availability of books and the price charged by the various institutions for their digitisation were taken into account. However, with more choice being present due to the number of identifiable books annotated by Dee, further decision about what of his library should be digitise relied on intellectual interest. It was decided that primarily, the books selected from Dee should comprise of types and styles of reader interventions that are not represented in the Harvey corpus, as Dee’s corpus contains several new interventions, including the use of additional symbols, genealogical trees, complex astrological charts, dense tables, and expansive drawings. Additionally, to further reflect a variety of reading and annotation strategies, the AoR Dee corpus also includes lightly annotated books such as Euclid’s Elementorum libri XV, as well as different book formats, ranging from Cicero’s Opera in folio to Gerhard Dorn’s Chymisticum artificium in octavo. Lastly, in relation to Dee’s library in its entirety, as in Harvey’s corpus, the books included in Dee’s corpus were selected to reflect the various intellectual interests which Dee pursued throughout his life, including mathematics, astrology/astronomy, medieval history, and New World discovery. The utmost goal when curating both corpora was an act of balance, reflecting the attempt to cover a representative selection of both readers’ intellectual interests and the ways in which they interacted with their books.
5.2.3 Early Modern Annotated Books
The Early Modern Annotated Books collection hosted on Calisphere, a digital collections hosting platform for cultural heritage institutions based in California, was largely curated by the William Andrews Clark Memorial Library (the Clark) which is administered by the University of California (Los Angeles)’s Center for 17th & 18th Century Studies. This rare book and manuscript library specializes in the study of England and the Continent from the Tudor period through the long eighteenth century.101 The digitisation of the Early Modern Annotated Books collection was initially a 2014 pilot project to digitize just ten annotated books from the Clark library, largely conducted by Philip Palmer who at the time was employed for a CLIR postdoctoral fellowship on the subject of “Manuscript Annotations in Early Modern Printed Books”. A small grant from the Gladys Krieble Delmas Foundation allowed the ten books to be transcribed through the hiring of three graduate students onto the project, and the further digitisation of annotated books within the Clark’s collections was made possible through funding from the National Endowment for the Humanities, which awarded the library a Humanities Collections and Reference Resources Grant in 2017.102
The collection process of the William Andrews Clark Memorial Library lacks clarity; the metadata is largely bibliographic, and some books include a section on provenance, but it is the provenance of the physical item rather than the digital. There is no specific information on when the Early Modern Annotated Books collection was assembled in both physical and digital form. Palmer states that the process of digitisation began in 2014, however when referencing the funding statement given in the collection’s official description, it is implied that the books were captured during the time which the National Endowment for the Humanities grant was held, between 2017 until the project’s end in October 2018. There is no clear information provided on the tools used by the Clark for digitization, although looking at the EXIF data extracted by my annotation application, there are tags such as GPS common in TIFF images that may point to a camera having been used over technology like a scanner. In contrast to the NLS and AoR, there is also very little information about the decision-making process made in the curation of Early Modern Annotated Books collection. Palmer selected the first ten books to be digitised for the collection based on how they were “representative of the characteristic idiosyncrasy that historical readers brought to their material readings of books”, however it is unclear exactly which ten books these are.103 Based on those which he discussed in his 2018 blog post on the project, this ten may have included a copy of Sir Thomas Browne’s Pseudodoxia epidemica, a copy of the 1603 English translation of Montaigne’s Essayes, Richard Allestree’s The Art of Contentment (1675), Aleazar Albin’s The Natural History of English Song-Birds (1779), Sir Richard Blackmore’s Prince Arthur, and Voltaire’s Dictionnaire Philosophique.
Evidently, the Clark’s Early Modern Annotated Books collection is the collection which leaves the most unknowns, and this seems to be at least in part due to the focus on the digitised books as being surrogates for the physical object, rather than a “new edition”.104 The metadata associated with each book appears to be about the physical book or where the physical book is within the holding institution, and this notion is affirmed by the Calisphere “statement on digital primary resources”.105 In this statement, these digitised entries are referred to as primary sources themselves and in the section discussing their metadata, they are discussing metadata created from cataloguing the physical item rather than from the digital. It seems that this may not have always been the case, given the pilot project which started the Early Modern Annotated Books collection attempted to incorporate elements of the AoR project’s XML schema for the original ten books, however this effort seemed to be abandoned once the project moved past the pilot, and even the XML files and transcribed annotations that did exist appear to be no more, with the link provided in the already obscured blog post describing this process being broken.106 The neglect of the pilot project that originated this collection is also an issue in itself. There is no evident reference to Palmer’s work on developing the project on any of the institutional platforms that define the archive, yet all in-depth information on this collection is derived from a blog post by Palmer written in 2018, which I found by happenstance since this post was a guest publication on the AoR website’s blog section. The link to any discussion on how this digital archive came to be is severed to those looking at the collection as it is presented on Calisphere. Further, all additional content crafted by Palmer being no longer available seemingly indicates that the Clark made no effort to preserve these original components of their present collection.
5.2.4 Dataset Provenance
Although all digital collections used for this case study fell into the public domain and allowed their content to be used for research purposes, neither AoR nor the Clark’s Early Modern Annotated Books collection provided their data in an easily downloadable format for researchers who wish to work with their collections computationally. AoR does attempt to offer the relevant data via data releases throughout the project’s development, however these data releases contain only the project metadata and not the images needed for the purposes of annotation. In consideration of these limitations, I chose to take the common approach of webscraping to collect the images and associated metadata needed to build my training dataset. Webscraping is the automated process of extracting information and data from websites; it involves using digital tools to gather and parse through web pages, collecting data based on parameters set by the person using the scraper.
Using the Python programming language to write the scripts to perform webscraping, the general structure I followed for webscraping was first, gathering the links to each digitised text’s entry, then iterating over each page of the text to extract the image from the webpage and save it to my device. While this approach worked broadly, each archive had its own intricacies that required customization of the webscraping code. AoR uses Mirador, an all-encompassing viewer for exploring and interacting with digital objects and collections of cultural heritage materials, to display each book in their collection, the images are difficult to extract from the webpage’s HTML. To deal with Mirador, a simple webscraper would not work. Instead, I had to write code that would mimic a human being paging through the results and right-clicking ‘save as’, over and over again. This was accomplished with the Python library Selenium, which allows for the automation of web browser interactions– essentially, mimicking the actions a person might to perform a task should it be done manually. In this case, for each book I simulated the process of hitting right-click and “Save As” on each page image that was indicated as containing marginalia based on the transcription metadata AoR provided, entered what I desired the file name for the downloaded image to be, which in this context consisted of the page number followed by the book label (ex. 15-MattheusBeroaldus-Chronicum(Geneva-1575).jpg), then downloaded the image and hit the arrow button which would lead to the next page, where this process would then repeat until all pages had been downloaded. Since the Clark’s Early Modern Annotated Books collection is much larger than AoR, I firstly added the constraint that only books with a page count less than 450 should be downloaded to avoid overloading the storage on my device. Then, I was simply able to download each page image through extracting the link associated with the “Download Image” button present on each page entry.
As discussed, because the process of annotating images inherently removes them from their intended context which can contribute to their misuse, the metadata associated with each page was scraped alongside the images and appended as EXIF data so that each page would carry its archival context with it through the process of annotation. The metadata is transformed into a Python dictionary upon extraction from the webpage’s HTML, then this dictionary is transformed into JSON format. This structured data was attached to the image via the EXIF data’s UserComment field, and then the application extracts JSON data present in the UserComment field.107 This makes it so the metadata is viewable in-app, but also within the app’s save file, which is simply a JSON file.
Only the materials available through the NLS’s Data Foundry were made available from the beginning with the intention that they be used computationally. However, returning to the discussion of cultural heritage institutions appropriately formatting data for the intended audience, the Data Foundry distributes the metadata for their datasets as METS files at the item-level and ALTO XML files at page-level. Although the information contained within these files is valuable, these formats are very dense and difficult to parse for readers, human and computer alike, attempting to gather information from them. I attempted to use Python to parse the metadata NLS provides in these METS and ALTO files into the JSON format needed in order to be manipulated and used by the application, but this proved more difficult and required more time and energy than was perhaps warranted; just because something is computationally possible does not mean that it is necessarily easy to achieve. As with any other method, decisions must be made. Instead, as a compromise, I chose to rename each page to include the page number and the item-level reference number alongside the page-level reference number that was already present, so that the metadata files for each image could easily be found by searching the relevant reference number within in my file system.
5.3 Annotation Process and Dataset Formation
With the images for collections now downloaded and formatted, the process of annotating the images for use as training data was able to begin. I created a new folder for the project to contain the images I desired to annotate and the save file, and then into this folder I copied the 43 known images of chapbooks along with an assortment of randomly selected pages from the AoR and Early Modern Annotated Books collections. In the application, I created a new project and in the annotation editor, I added the column “notes”. Given the limited time frame I had available to dedicate to annotation, I felt that having one general purpose column would be sufficient to compliment the content of the default columns, allowing me space to make note of uncertainties or points of interest. I then added the images I wanted to annotate from the project folder into the workspace and began creating annotations. I ultimately ended up using the notes column to describe marginalia, particularly symbols, that I was unsure the meaning of. Once I finished annotating, I returned to these marginalia through using the application’s keyword search to find the relevant pages and was able to research and clarify the meaning of these mysteries, such as the manicule, which I was unaware was once a commonly hand-drawn symbol to denote an important passage of text to the reader among other similar functions.108
Following annotation, I used the application’s export functionality to save my images and their annotations in “You Only Look Once” (YOLO) format, since I intended to use a YOLO object detection model which will be discussed with more depth in the following section. In total, within the time frame I allotted to this task, 353 images of early modern book pages were annotated. Added into this set of images was 20 negative examples, that is, pages which contain no marginalia. This set of images was then randomly split using Python’s machine learning tool library sklearn into an 85/15 training/test ratio, with 317 (~85%) images being used to train the model, 39 (~10%) images being used to validate the model while it trains, and 17 (~5%) images to test the results of the trained model. A standard recommendation for training an object detection model is to have 1500 images per new class, so to give this small dataset a fighting chance at successfully detecting marginalia, I applied various transformations using a modified version of a data augmentation command line tool to the original training images to create augmented versions of this data. These transformations modified the images in ways that preserve their essential features but introduce variation that can enhance the model’s ability to generalize. Not only does data augmentation increase the amount of training data by generating multiple versions of each original image, but also by presenting the model with different variations of the same image (e.g., different rotations, flips, translations, zoom levels, etc.), data augmentation helps the model learn to recognize important patterns and features that are invariant to those transformations. At the same time, it also helps prevent the model from memorizing specific details of the training data which results in “overfitting”– we want a model that detects meaningful and relevant features rather than memorizing specific examples. In the context of this case study, each of the 317 training images were augmented through added noise, randomly changed contrast, randomly changed brightness, and randomly changed saturation. This expanded the total training image set to 1585 (317*4), however, even then, within the greater context of machine learning, this dataset is very small at only 795 MB.
5.4 The Machine Learning Model
For the purpose of object detection, I chose to use the YOLOv7 model.109 In general, the YOLO family of models function by processing the entire image just once to detect objects instead of iteratively analyzing an image multiple times at different scales to identify objects as other object detection models have traditionally done, which makes YOLO models perform the task of object detection faster and more efficiently compared to other models. YOLO models do this by first dividing a picture into a grid of smaller sections, and then for each of these smaller sections, the model tries to predict whether or not there is an object present in that grid, and if so, what kind of object it might be through drawing bounding boxes around the entirety of the possible object and assigning it a label. For each of these boxes drawn, the model will also assign a confidence score, which indicates how sure the model is that an object in that box. If the score is high, it means the model is quite confident, and conversely, if it is low, it is less certain. Lastly, after predicting objects in all of the image’s sections, the model eliminates any object that may have multiple bounding boxes drawn around it using a technique called Non-Maximum Suppression, which selects the best bounding boxes by keeping those with the highest confidence score and removing overlap or redundancy.
Compared to models that break the image down into more granular, pixel-level segmentation, YOLO models’ single-pass approach can struggle with smaller objects or complex scenery, however, should these limitations be considered when creating the training dataset, these issues can be countered through methods such as the addition of negative examples or data augmentation as described previously. Another advantage of the YOLO algorithm is that there is typically little need for negative examples; in the initial step of dividing the inputted image into a grid then analyzing each segment, the model will naturally learn how to identify “no object” since a majority of images will not contain objects in every grid segment. However, when the images being used to train the model are “busy” with the objects being detected possibly being present across the entire page, such as with images of traffic or in our case, with pages of text and prolific annotation, training results can be improved through the intentional addition of negative examples to reduce false positives caused by heavy overlap of desired objects and background objects.
The goal of this model is to detect marginalia present in the NLS chapbooks dataset in order gain a sense of how chapbooks were used by those who interacted with them. It is unlikely that the model will achieve exceptionally high performance due to the small amount of training data, however with YOLOv7’s efficient learning capabilities it is likely that the model will achieve a standard of performance that will be acceptable to garner the “bird’s eye view” of the chapbooks desired for this experiment. The alternative to machine learning for this project would be algorithmic computer vision, using a series of image augmentations such as feature extraction or template matching to identify areas of marginalia on a page. However, these techniques would not be able to achieve the same level of performance and adaptability as modern machine learning approaches, especially for complex and large-scale object detection tasks such as the one at hand. Machine learning techniques are much stronger at generalization, adapting better to various challenges, such as object variations, scale changes, occlusions, and complex scene contexts.
My dataset is small, so rather than training a model from scratch which would likely yield poor results due to this limitation, I chose to use transfer learning with one of YOLOv7’s pretrained models. Transfer learning is a machine learning technique where a model that has been trained on one task is repurposed or “finetuned” for a different but related task. Instead of starting from scratch, the knowledge gained from solving one problem is transferred to help solve a different problem; this not only saves time and resources since the model is not being built from the ground up, it also builds upon what the model has already learned about recognizing characteristics such as shapes and patterns, making it more efficient and effective at expanding this palette. Under the guidance of the YOLOv7 paper, while also accounting for the technical parameters of my dataset and hardware being used, I chose the YOLOv7-E6 pretrained model to build off of. The YOLOv7-E6 model is designed for larger input sizes, that is to say, higher resolution images, which helps in capturing smaller details in an image, as well as for use with cloud GPUs.110 Cloud GPUs are remote graphics processing units that can be rented or accessed on-demand through cloud computing services for various computational tasks, particularly those involving machine learning workloads since machine learning makes use of the parallel processing capabilities GPUs possess which allow for multiple calculations to be done simultaneously, making complex computation faster and more efficient. In general, cloud GPUs are used because they allow for the use of a more powerful GPU than one typically has on hand, however they can also be a more environmentally conscious choice; cloud computing allows for resource sharing among multiple users which reduces the overall energy consumption compared to individuals running their own hardware.
To train my model, I chose to use an NVIDIA RTX A6000 GPU from provider Vast.ai, a market-based cloud computing platform which allows all compute providers large and small to easily share their devices’ spare capacity. In using the spare capacity of an already running device, platform such as Vast.ai help democratise advanced machine learning research by those without institutional access to compute through more affordable pricing than other cloud computing providers who own and allocate dedicated GPUs to users as requested. I chose to use an an RTX A6000 due to the high amount of virtual memory which is necessary when training with a higher image resolution, but also because it was available from a Swedish data centre; nearly 75% of electricity production in Sweden comes from renewable, green energy sources, meaning that using a GPU located in Sweden will likely produce less carbon dioxide emissions compared to a GPU present elsewhere.111 Undoubtedly the most resource intensive component of this project was training the model. Although I did not track the carbon emissions of the model as it trained, I utilized the Machine Learning CO2 Impact calculator, which uses the formula of power consumption x time x carbon produced based on the local power grid to estimate the carbon emissions of my training.112 Since Vast.ai follows a market place shared compute model, I used the Stockholm-based Amazon Web Services datacenter to stand in for the Swedish datacenter which I rented the RTX A6000 used for training from. Approximately 15 hours of computation was performed using this GPU, which has a TDP of 300W, between initial attempt at transfer learning and a following attempt after updating hyperparameters for better performance. Region eu-north-1 has a carbon efficiency of 0.05 kgCO\(_{2}\)eq/kWh thus the total emissions are estimated to be 0.23 kgCO\(_{2}\)eq, which is the equivalent of around 1km driven in a car with an internal combustion engine.
To train my model, I was able to follow the command for transfer learning provided in the YOLOv7 GitHub repository. There were a small number of changes to the training code suggested in the repository’s issues page which I applied prior to starting training; firstly, I lowered the learning rate hyperparameter. A hyperparameter in the context of machine learning is essentially the setting of the model; often, the defaults provided work fine, however, results sometimes can be improved through slight modifications. The learning rate is like a step size that determines how quickly or slowly a model adjusts to its new parameters as it learns from training; a lower learning rate means taking smaller, more “detailed” steps towards learning which in turn improves how well the model is able to learn. Secondly, I updated the ar_thr variable in dataset.py from 20 to 100; ar_thr refers to the aspect ratio threshold which is a value that determines whether an object’s bounding box should be included in the training data or not based on its aspect ratio. Since I recalled from the process of annotation that some bounding boxes were quite tall or thin, I chose to make the accepted aspect ratio larger to ensure that no bounding boxes were eliminated from the images while training.
The key metrics produced upon testing a YOLOv7 model to evaluate its performance are precision, recall, and mean average precision (mAP). Precision is the ratio between actual positive detections and all positive detections; in the context of this model, that would be the measure of marginalia detected on the page out of all the marginalia actually present. Recall indicates how well a model correctly detects the objects broadly; thus, for all the marginalia present, recall tells us how many were correctly detected. The mAP compares the bounding box that was drawn by the annotator, the ground-truth bounding box, to the bounding box detected by the model and returns a score; this score determines if an object has been successfully detected or not. YOLOv7 evaluates the model using mAP@.5 specifically; the appended .5 indicates the Intersection-over-Union (IoU) threshold, which measures the minimum overlap between the model’s predicted boundary and the ground truth for the detection to be considered correct. After training the model for 150 epochs, a single epoch being one pass through the entire training dataset during the training process, when tested on the test set of pages the model outputted a precision score of 77.6%, a recall score of 79.5%, and a mAP@.5 of 77.1%. So, when the model predicts marginalia, it is generally correct, and the model is able to find and capture a substantial portion of the actual marginalia. Considering the small size of the training dataset and the goals of this project as a whole, these results are acceptable enough that the model should provide reasonably accurate detections of marginalia when applied to the NLS chapbook dataset.
5.5 Results
Of the 47329 pages present in the NLS chapbook dataset, a total of 10560 pages were detected as containing marginalia. Of these pages, 4239 actually contained marginalia (true positives), whereas the remaining 6321 contained aspects of pages which the model mistook as being marginalia (false positives). This significant number of false positives is in large part due to my decision to set the confidence score to 0.05 or 5% when using the model on the chapbook pages. The confidence score in the context of detection means that when the model is searching the pages for marginalia, if the model is at least 5% certain that something it found is marginalia, it will draw a bounding box around it. I set the confidence score lower to ensure no marginalia was missed given the lower precision score of the model.
TP: 4239
| Category | Count | Definition |
|---|---|---|
| Archival Traces | 3736 | Notes clearly denoting the archival life of the chapbook prior to digitization |
| Numbers | 131 | Numeric marginalia with no clear link to archival purposes |
| Uncertain | 111 | Primarily marginalia which is illegible due to ink, fading, font etc |
| Graphical Reading Systems | 103 | Symbols which denote active reading |
| Marks of Ownership | 60 | Names or initials |
| Corrections | 51 | Interaction with the text that primarily comprises of editing the contents |
| Text Interaction | 31 | Commentary on the text or about it |
| Mathematics | 7 | Math equations |
| Pen Trials | 7 | Scribbles or letters which serve to test the writing tool |
| Inserted Notes | 2 | Notes inserted into chapbooks |
The most surprising outcome from these detections is how few of the pages actually contained marginalia penned by early modern readers. A vast majority of the pages with detected marginalia show instead the archival lives of the chapbook. Some of the earliest archival marks are potentially early modern in a generous sense; there are a number of chapbooks with “No. __” penned with ink in a cursive hand on the title page, and typically also found on these pages is a stamp which reads “Edin. S.S. Library”. This is the mark of Edinburgh Select Subscription Library, a private subscription-based library where the subscription was not only to borrow books but to hold a share in the library, creating a library which was owned by its shareholders. The Edinburgh Select Subscription Library was founded in 1800 by a group of ten young men to rival the earlier established Edinburgh Subscription Library, who they felt had too high of subscription fees.113 Aside from these marks, the remaining signs of cataloging are more contemporary. There is a handful of descriptive notes within the chapbooks which appear to be from the 20th century as are dated with the year 1910. This is likely the work of Fairley himself considering this would only be around 16 years prior to the NLS’s acquisition of the Lauriston Castle collections. The most recent of the archival notes detected are numbers penciled in the upper corners of some of the images, on a paper placed behind the chapbook page rather than on the page itself. These numbers correspond to the final digits present in the NLS shelf mark of each chapbook, so presumably these are present in the images as reference for the pages being scanned.
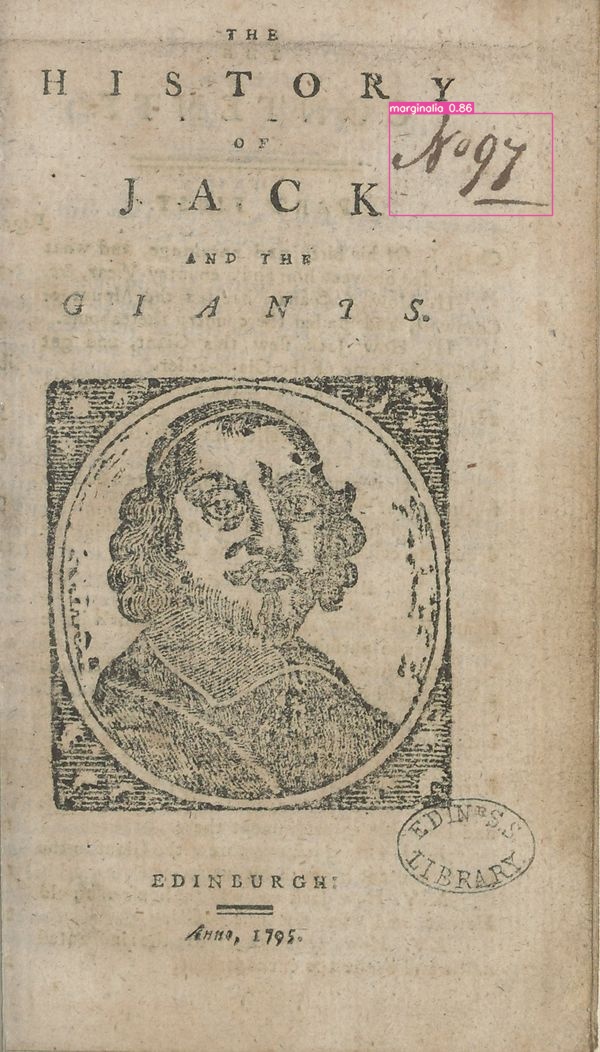
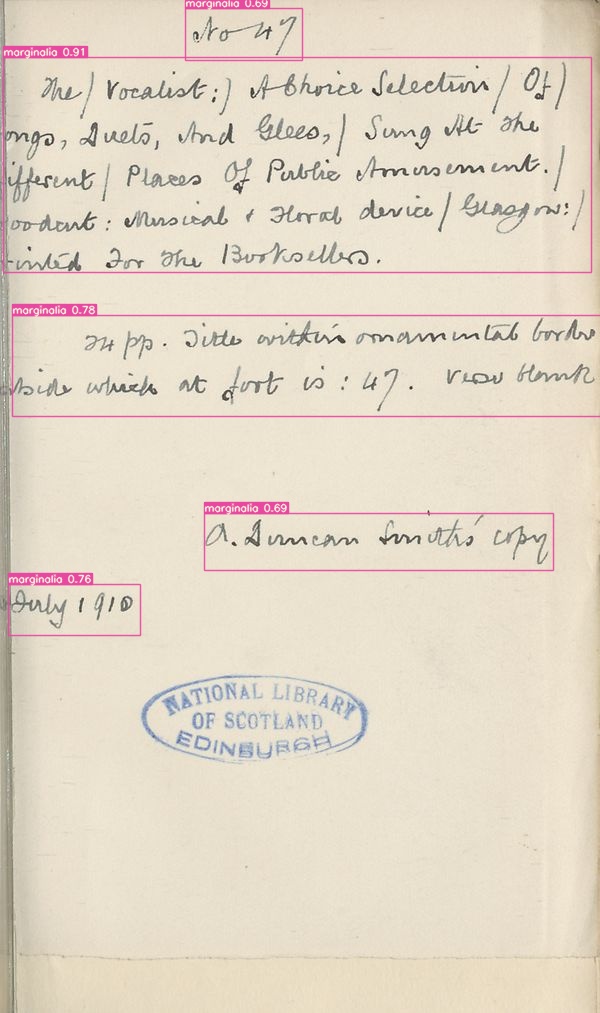
Figure 5.1: Left: Edinburgh Select Subscription Library marks. The History of Jack and the Giants, 1795, National Library of Scotland, http://digital.nls.uk/104184561. Right: Contemporary notes possibly belonging to John A Fairley. Printed for the Booksellers, The Vocalist’s Song Book, ca. 1840, National Library of Scotland, Associated metadata file from Data Foundry: 104185187-mets.xml
Notable outside of archival reference are the numerous examples of marks of ownership. The model uncovered even more of John Watson’s exuberant signatures alongside new frequent signers, such as William Smitton who neatly placed his mark at the top of each of his ten chapbooks’ title pages. Slightly less common but still notably present is another reader named Peter Smitton, whose signature appears in a similar placement to William’s within older chapbooks seven times, revealing perhaps a generation of chapbook consumers. There is also occasionally evidence of female readership, with a reader named Margaret Cameron labelling her three books in a manner similar to the Smittons.
![**From left to right:** marks of ownership by Peter Smitton^[Printed by J. & M. Robertson, *A Wedding-Ring, Fit for the Finger*, 1799, National Library of Scotland, http://digital.nls.uk/104185291.], William Smitton^[Printed by T. Johnston for Robert Gregon a young man nearly blind, *A Sinner Reclaimed*, 1814, National Library of Scotland, http://digital.nls.uk/104185116.], and Margaret Cameron.^[Printed by D. Macarter & Sons, Ayr, *The History of Duncan Campbell, and his dog Oscar*, ca. 1817, National Library of Scotland, http://digital.nls.uk/104184176.]](assets/images/PS.jpg)
![**From left to right:** marks of ownership by Peter Smitton^[Printed by J. & M. Robertson, *A Wedding-Ring, Fit for the Finger*, 1799, National Library of Scotland, http://digital.nls.uk/104185291.], William Smitton^[Printed by T. Johnston for Robert Gregon a young man nearly blind, *A Sinner Reclaimed*, 1814, National Library of Scotland, http://digital.nls.uk/104185116.], and Margaret Cameron.^[Printed by D. Macarter & Sons, Ayr, *The History of Duncan Campbell, and his dog Oscar*, ca. 1817, National Library of Scotland, http://digital.nls.uk/104184176.]](assets/images/WS.jpg)
![**From left to right:** marks of ownership by Peter Smitton^[Printed by J. & M. Robertson, *A Wedding-Ring, Fit for the Finger*, 1799, National Library of Scotland, http://digital.nls.uk/104185291.], William Smitton^[Printed by T. Johnston for Robert Gregon a young man nearly blind, *A Sinner Reclaimed*, 1814, National Library of Scotland, http://digital.nls.uk/104185116.], and Margaret Cameron.^[Printed by D. Macarter & Sons, Ayr, *The History of Duncan Campbell, and his dog Oscar*, ca. 1817, National Library of Scotland, http://digital.nls.uk/104184176.]](assets/images/MC.jpg)
Figure 5.2: From left to right: marks of ownership by Peter Smitton114, William Smitton115, and Margaret Cameron.116
Beyond marks of ownership, there is evidence of the chapbooks being used for more pragmatic tasks. One of the first detections the model made and only one of this type was of what appears to be tally marks, perhaps someone keeping count of a task or a game or other common repetitive task, such as transactions. I propose game primarily, because the tally marks seem to be accompanied by some unusual scrawlings beneath, possibly a rudimentary attempt at spelling by a child. There were also a handful of more sophisticated examples of mathematics detected within the chapbook pages, with 7 sequences of multiplication and addition detected, being performed for an unspecified task. There are examples of similar calculations being performed in the Early Modern Annotated Books collections in the almanac-turned-account book of an 18th century wigmaker, so perhaps these chapbook calculations were also related to business, personal or professional.117
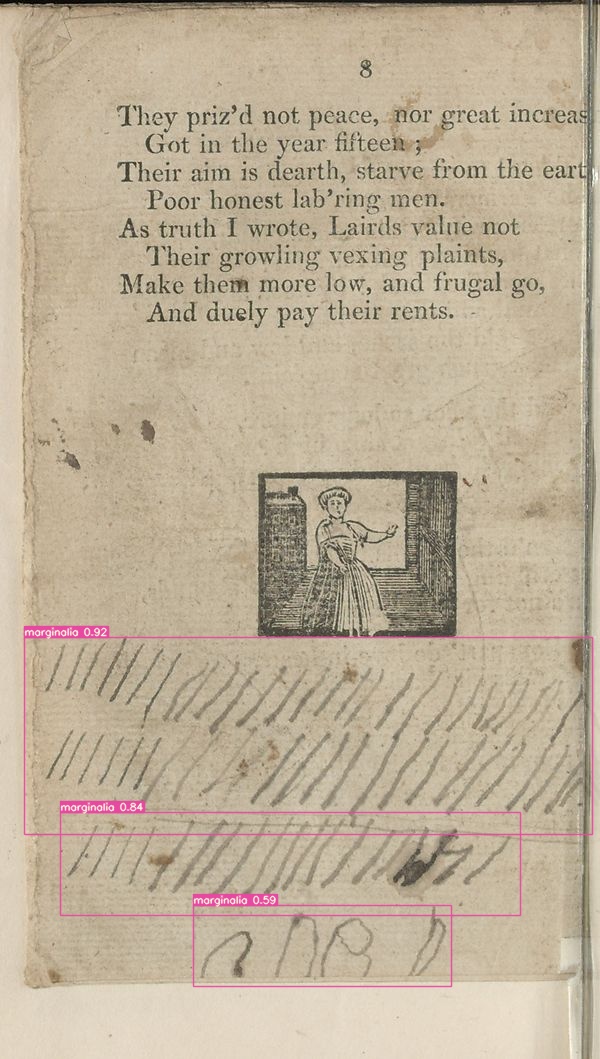
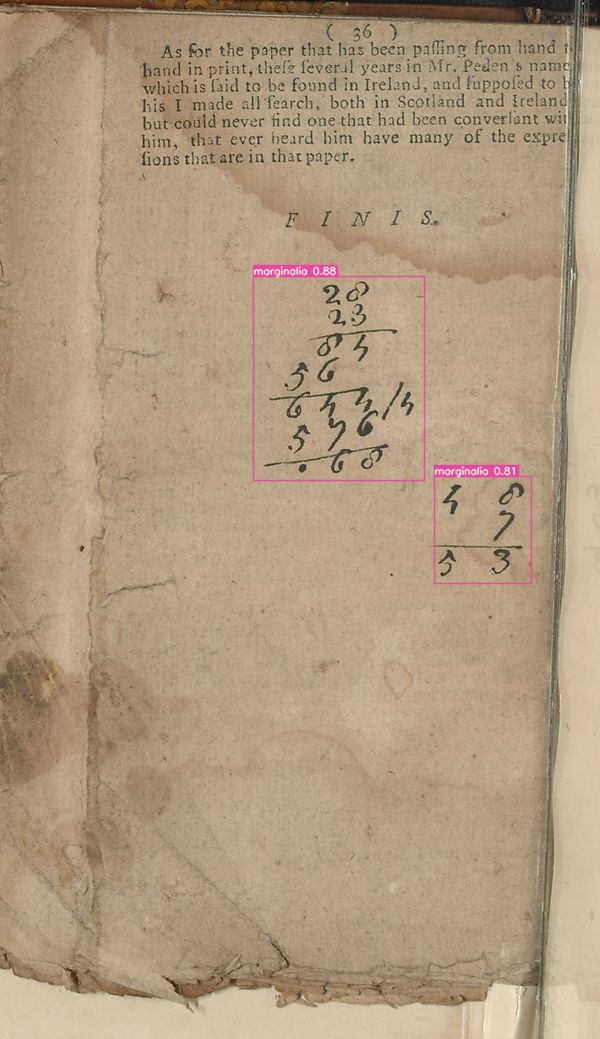
Figure 5.3: Left: Mysterious tally marks. Printed by D. Macarter & Co, The Historical Ballad of May Culzean, ca. 1817, National Library of Scotland, http://digital.nls.uk/104184172. Right: Example of math equation. Some Remarkable Passages of the Life and Death of Master Alexander Peden, 1760, National Library of Scotland, http://digital.nls.uk/104185268.
There were also marginalia detected that demonstrated engagement with the chapbook’s text. There are a number of examples of light annotation which might fall under what Grindley classified as “Narrative Reading Aids”, with notes clarifying the meaning of words or phrases the reader seemingly did not initially understand; for example, one reader upon coming across the term “Whip whire” wrote below it, “Bird”. There are also examples of literary response, primarily in the form of correcting and expanding the chapbook’s text. Moreover, graphical responses using systemised forms of graphic shorthand or added punctuation are plentiful, with crosses (+) and x marks being left in places which the reader deemed notable or significant to their understanding of or connection to the text.
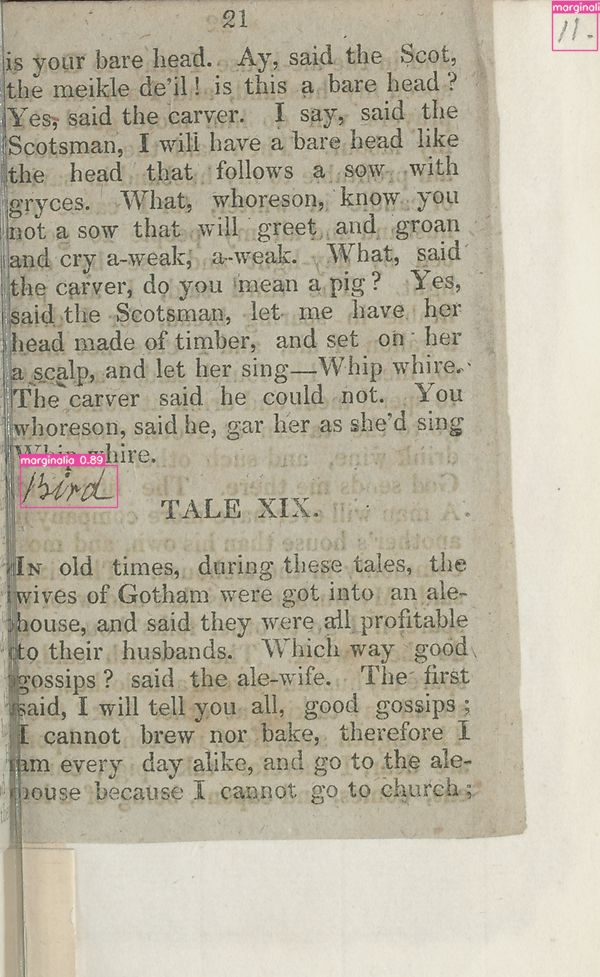
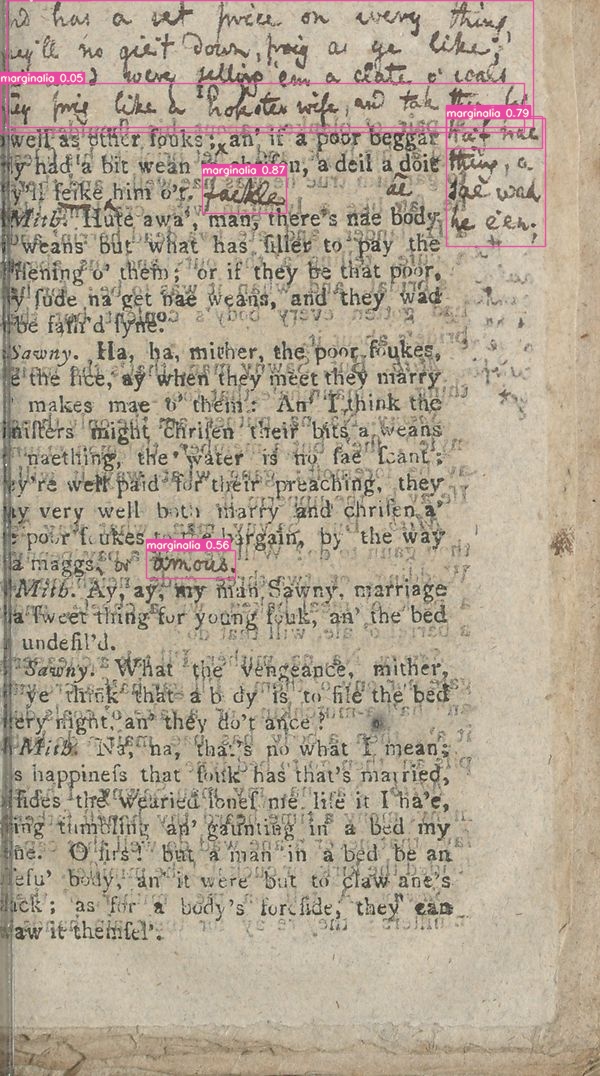
Figure 5.4: Left: A note clarifying the meaning of ‘Whip whire’. Printed for the booksellers in town and country, The Merry Tales of the Wise Men of Gotham, ca. 1815, National Library of Scotland, http://digital.nls.uk/104184792. Right: Interactions with the text. The Coalman’s courtship to a Creelwife’s Daughter, ca. 1799, National Library of Scotland, Associated metadata file from Data Foundry: 104186983-mets.xml.
5.5.1 False Positives
FP: 6321
| Category | Count | Definition |
|---|---|---|
| Print flaws | 2815 | Poor printing quality resulting in random ink marks on page which model mistook for marginalia |
| Illustrations | 1169 | As implied |
| Ink Bleeding | 767 | Ink bleeding through pages forming what appears to be new marginalia |
| Mistaken reading systems | 686 | Symbols within printed text near places which annotators have used symbols in training data |
| Font | 551 | Rough or italicized section of printed text which results in model mistaking irregularities for handwriting |
| Paper quality | 266 | Poor paper quality with visible fibers and significant creasing causing shadows on page which model mistake for marginalia |
| Ink spills | 33 | Ink splatters on page |
| Printed tables | 18 | In training data, tables are largely hand drawn, so model mistook printed tables for handdrawn ones |
| Hand traces | 16 | Thumb prints |
Within this collection of pages that the model detected as containing marginalia, there were many false positives which is expected given the middling evaluation metrics outputted for this model. However, the patterns found within these false positive detections offer clear insight into where the training dataset could be strengthened. The model detected ink smudges from hands, ink bleeds through the pages of the paltry paper, ink spills, and printing errors as marginalia– all elements which demonstrate the rough process of production and the human touch which chapbooks underwent in their early lives. Although there were certain pages that had been weathered with age in the training dataset, in general, the pages in the training dataset were much cleaner than the chapbook pages, due to what appears to be higher quality paper and more careful printing methods.
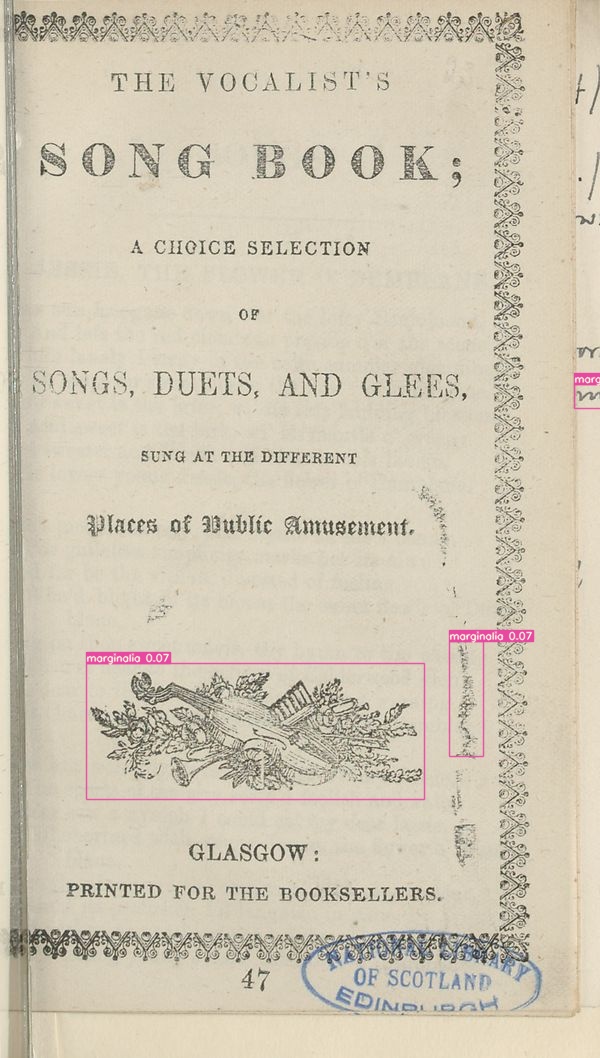
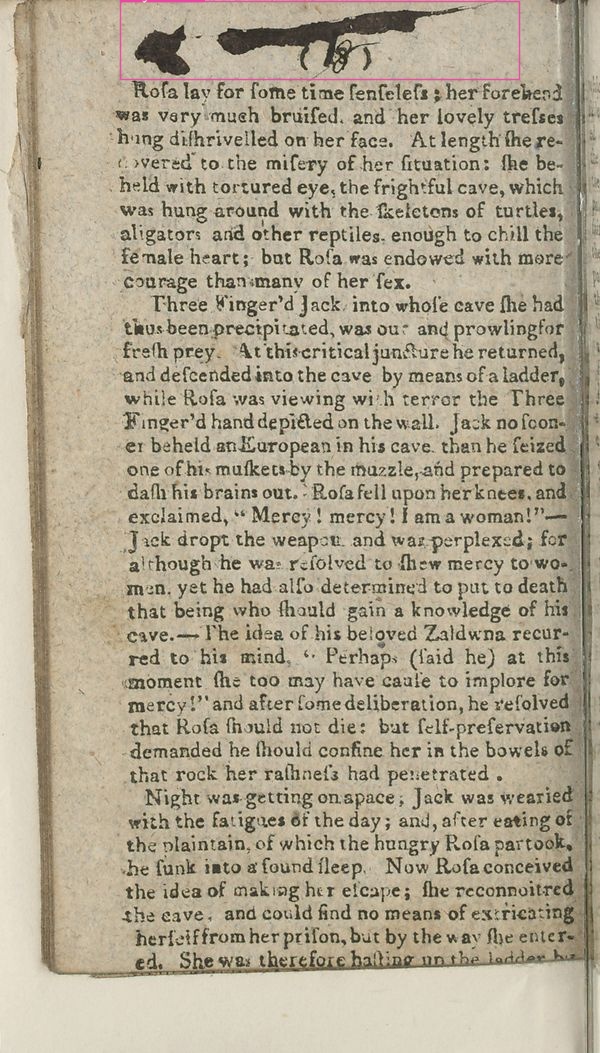
Figure 5.5: Left: Flaws from printing press. Printed for the Booksellers, The Vocalist’s Song Book, ca. 1840, National Library of Scotland, Associated metadata file from Data Foundry: 104185187-mets.xml. Right: Example of an ink spill. Printed and sold by T. Johnston, The History and Adventures of Three Finger’d Jack, 1822, National Library of Scotland, http://digital.nls.uk/104185025.
Roughly printed punctuation marks present near the page margins were often detected as marginalia, likely due to the way their placement and appearance is similar to the systemised forms of graphic shorthand employed by readers Dee and Harvey, who were both heavily featured in the training data (see Figure 6). Likewise, sections of printed text which were italicized, unclear due to imprecise printing, obscured by the text on the previous page seeping through, or any combination of these factors would occasionally be misdetected as being handwritten. These flaws showcase a level of irregularity that the machine understands as being characteristic of handwritten rather than printed text.
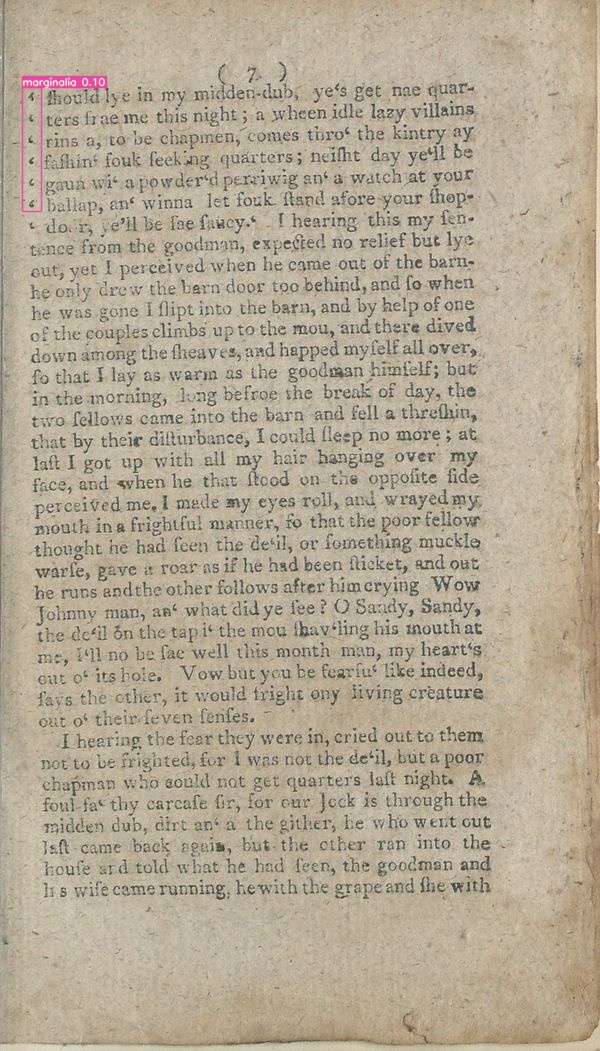
Figure 5.6: Left: Mistaken punctuation. Printed and sold by John Morren East Campbell’s Close, Cowgate, The History of John Cheap the Comical Chapman, ca. 1800, National Library of Scotland, http://digital.nls.uk/104184596. Compare to right: Harvey reading system. Titus Livius, Romanae historiae principis, 1555, Princeton University Library, https://archaeologyofreading.org/viewer/#aor/PrincetonPA6452/binding.frontcover/image.
For related reasons, the model also extensively detected the woodcut illustrations and page decorations within the chapbooks as marginalia. This is a particularly notable flaw in my dataset, as upon revision of the images annotated, there are very few examples that included illustrations on the page alongside marginalia meaning that the model never learned to fully differentiate between these types of “free form” shapes. In this same vein, within the training data there was a small number of hand-drawn tables, thus the model was able to gain an understanding of the tables’ shape but not necessarily the features which distinguished these tables as being hand-drawn, resulting in the printed tables present in the chapbooks being detected as marginalia.
5.5.2 Man vs Machine
When comparing the performance of this model to that of a human when it comes to locating marginalia, the first thought may be that a human would perform better, as we would not create the false positives that the model did. It is true that the human brain is much better at identifying objects it may have seen only a handful of times– but, to manually perform the task that the model did, we would have had to look at each page of all the chapbooks present in the NLS collection one by one. When discussing his manual process of finding and studying marginalia for Used Books, Sherman indicated that his work had taken over a decade to complete.118 In contrast, the model took approximately 1.5 hours to iterate over and detect marginalia across the entire collection of chapbooks, then it took me around 8 hours to go through the outputted pages and sort them into categories. The goal for this case study was not necessarily to create a model that is better than humans (although it certainly could be improved to be closer to our ability), but to create a tool that makes the process of finding and by extension studying marginalia much faster/more efficient. Although, in saying this, the model did perform well when it came to finding marginalia that I feel I likely would have missed; for example, in a chapbook otherwise devoid of marginalia there appears to be one page that has either a possible mark of ownership or pen trial peeking out from the edge of the page.
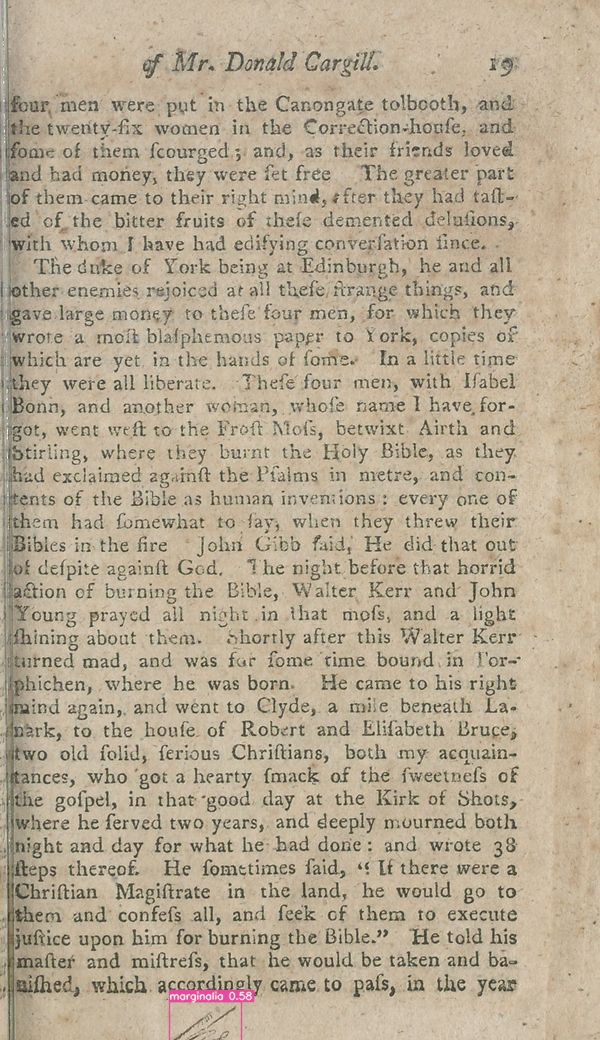
Figure 5.7: Marginlia peeking over the image edge. Printed by J. Neilson, The Life and Prophecies of that Faithful Minister of God’s Word, Mr Donald Cargill, 1812, National Library of Scotland, http://digital.nls.uk/104186348.
It seems that this page was poorly cropped following digitization, so at first glance these fine pen marks look as if they could be another artifact of printing or fiber in the paper and be passed over if the researcher is not intensely focussed on the task at hand. One advantage that machines do have over humans is that we get tired by repetitive tasks and in response may become inattentive or start rushing to finish, whereas machines do not experience this
It should be noted that this study of false positives is where the application showed its use beyond just the image annotation functionality. I was easily able to reflect upon the training data and identify the source of these false positives through simply opening the annotation project in the application. I was able to revise the quality of my annotations and what my training data lacked in comparison with how the model performed. Having an easy way to view and search my clearly recorded training data gave me the ability to see the potential my model has for improvement.
5.6 Discussion
One categorical observation that can be made about these marks broadly is that when comparing the marks of ownership which appear to belong to children as indicated by their larger and less constrained hand writing, to those of adults, it seems that children often like to assert firm claim upon the chapbook by appending statements such as “his book” or “is my name” to their signature, occasionally alongside a misspelled date. In his research on children’s marginalia, scholar Seth Lerer identifies these as “stories of possession”; notes which clearly define who the text belonged to, protecting an object perceived as important by the owner.119 Evidence of what appears to be children sharing did however, also show up among the detections, with one page of a chapbook bearing three different names all in different hands and pens, the chapbook seemingly being used as hand writing practice for a group of friends or siblings.
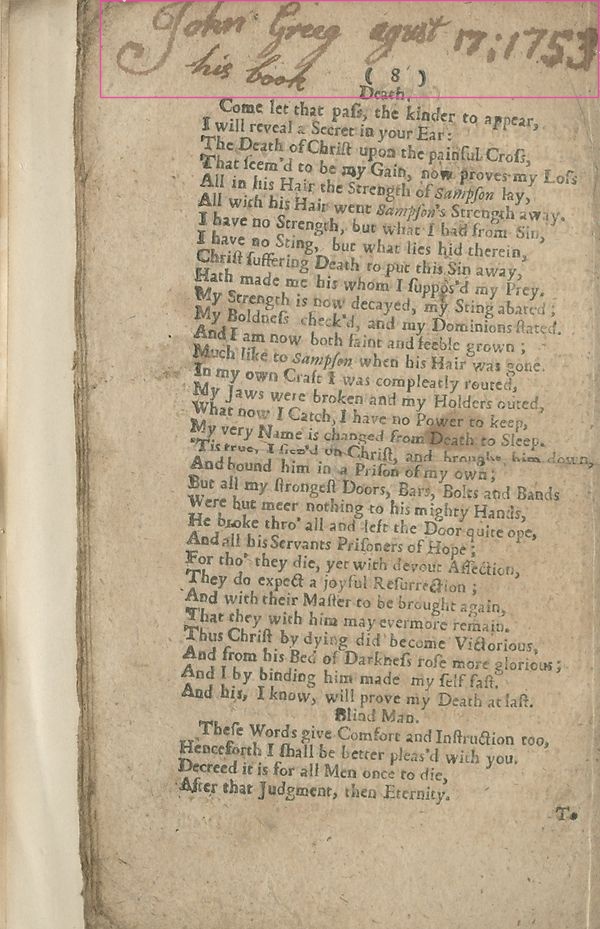
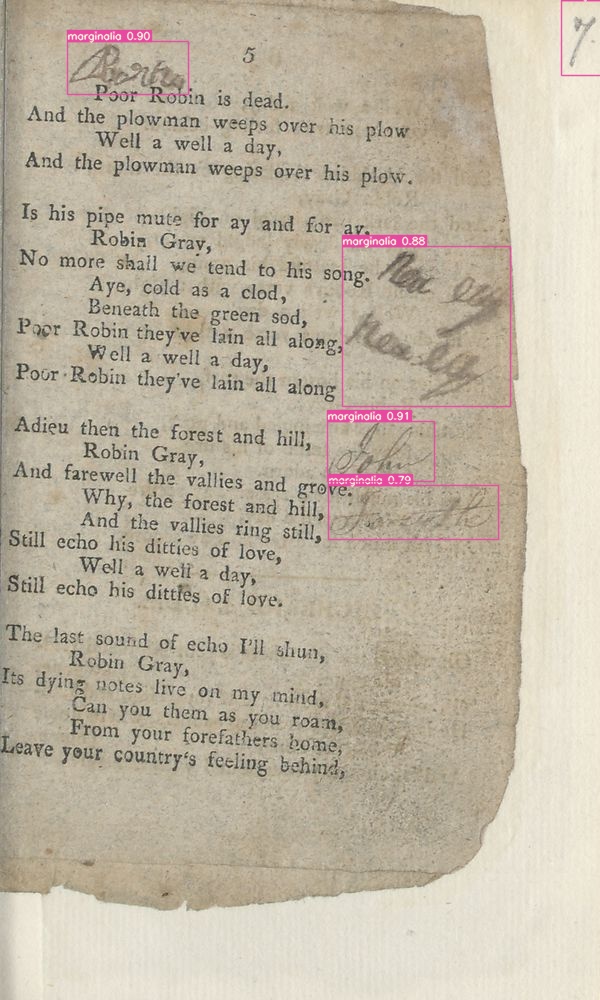
Figure 5.8: Left: A book claim. Printed and sold in Swan-Close, A Dialogue between a Blind Man and Death, ca. 1740, National Library of Scotland, http://digital.nls.uk/104184326. Right: A collection of signatures. Printed for the booksellers, Birks of Aberfeldy, 1817, National Library of Scotland, http://digital.nls.uk/104184636.
I began this project believing that chapbooks would be the perfect medium for marginalia of the “common” class, given how prolific yet affordable these little books were. Yet the results from the model made me question, why is there so few pages with marginalia present? Observing the chapbook marginalia in its entirety, outside of the content written on the page, an interesting history of the object emerges through a way in which the physical properties of the chapbook’s materiality become apparent despite digital format via the writing mediums used by the annotators. In his entry within Early Modern English Marginalia, scholar Joshua Calhoun introduces the topic of gelatin sizing, the viscous gelatin solution in which paper was dipped during the early modern period to render it suitable for writing with the water-based ink used for manuscript.120 Conversely, this discussion also brings up the topic of poorly sized paper and “sinking”, a contemporary term used to describe paper that could not hold its ink; using porous paper would cause ink to spread, absorb, or run on being applied to it.121 Chapbooks, evidently, were printed on paper that was at most poorly sized, and the marginalia clearly illustrate this. Many marginalia such as that of John Watson’s look as if they were written with water colours due to the way the ink spread on the paper, and even the clearest marginalia still suffered from some bleeding along the edges and the occasional blob of ink, obscuring what is written. There are multiple instances of detected marginalia sinking so severely that their meaning is blotted out completely. While chapbooks may seem to be an ideal medium for quick notes and scrap paper given their low cost and proliferation, perhaps such a small percentage of the pages actually contain marginalia in practice since the construct of the paper did not lend itself well to being annotated. Adult annotators, at least, did not want to write on such poor quality paper, it was a last resort option. Further extrapolating, those who did need to use chapbooks may have used pencils to avoid sinking, but which faded as exemplified by the pencil marks that were present in the model’s detections. The most obvious reasoning for the lack of marginalia, thought, is that chapbooks which saw have use were likely damaged and disintegrated over time due to the poor materials used in their construction.
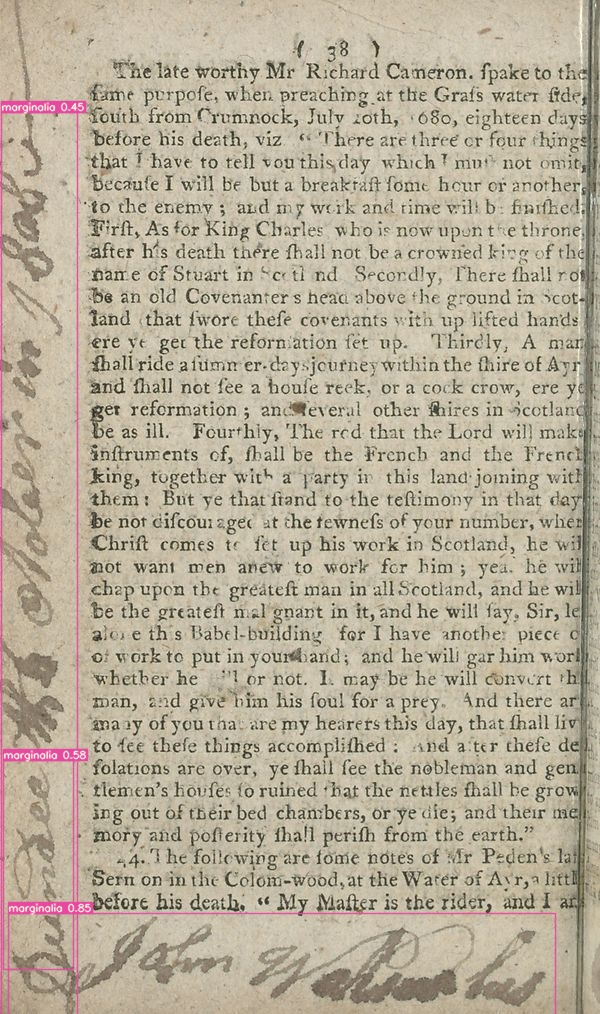
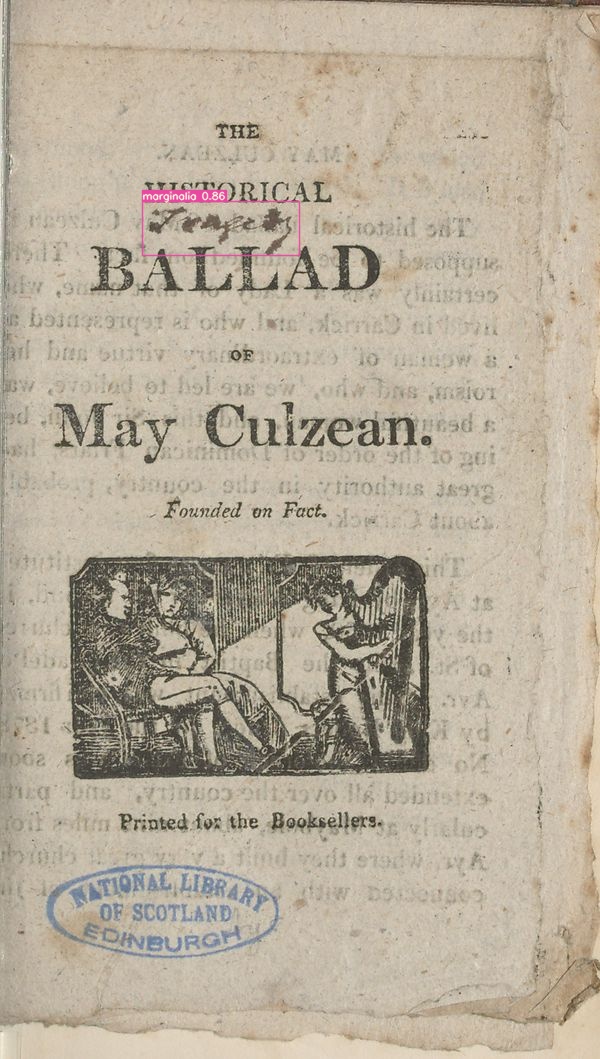
Figure 5.9: Left: John Watson’s absorbed ink. The Life and Prophecies of Mr. Alexander Peden, ca. 1800, National Library of Scotland, Associated metadata file from Data Foundry: 104186661-mets.xml Right: Ink bleeding to the point of illegibility. Printed for the booksellers, The Historical Ballad of May Culzean, ca. 1817, National Library of Scotland, http://digital.nls.uk/104184173.
Clemens Neudecker, “Cultural Heritage as Data: Digital Curation and Artificial Intelligence in Libraries,” in Proceedings of the Third Conference on Digital Curation Technologies (Qurator 2022), Berlin, Germany, Sept. 19th-23rd, 2022, ed. Adrian Paschke et al., vol. 3234, CEUR Workshop Proceedings (CEUR-WS.org, 2022), 5, https://ceur-ws.org/Vol-3234/paper2.pdf.↩︎
Victoria and Albert Museum, “Victoria and Albert Museum Collections Data,” 2021, https://collections.vam.ac.uk/.↩︎
“Getty API Documentation,” Getty, accessed August 18, 2023, https://data.getty.edu/museum/collection/docs/#attribution.↩︎
Elizabeth Yale, “The History of Archives: The State of the Discipline,” Book History 18 (2015): 332, https://doi.org/10.1353/bh.2015.0007.↩︎
Benjamin Charles Germain Lee, “The ‘Collections as ML Data’ Checklist for Machine Learning and Cultural Heritage,” Journal of the Association for Information Science and Technology n/a, no. n/a (May 2023): 2, https://doi.org/10.1002/asi.24765.↩︎
“Results – Search Objects – eMuseum,” Peabody Museum of Archaeology & Ethnology, accessed August 21, 2023, https://collections.peabody.harvard.edu/search/daguerreotype/objects.↩︎
Baio, “Exploring 12 Million of the 2.3 Billion Images Used to Train Stable Diffusion’s Image Generator”.↩︎
“Laion-Aesthetic-6pls: Images 1582553,” LAION-Aesthetics V2 6+, accessed August 21, 2023, http://laion-aesthetic.datasette.io/laion-aesthetic-6pls/images/1582553.↩︎
Lee, “The ‘Collections as ML Data’ Checklist for Machine Learning and Cultural Heritage”.↩︎
Lee, “The ‘Collections as ML Data’ Checklist for Machine Learning and Cultural Heritage,” 2.↩︎
The checklist in its original form is attached as an appendix to this project. Due to the nature of this project being an MRE, I did not answer all questions relating to organizational concerns since I am producing this MRE outside of a corporate or workplace setting.↩︎
Lee, “The ‘Collections as ML Data’ Checklist for Machine Learning and Cultural Heritage,” 19.↩︎
“Lauriston Castle Collection,” accessed August 16, 2023, https://digital.nls.uk/catalogues/special-and-named-printed-collections/?id=598.↩︎
“Archaeology of Reading”, “How to do AoR Yourself.”↩︎
“Archaeology of Reading”, “A History of Gabriel Harvey’s Library.”↩︎
“Archaeology of Reading”, “A History of John Dee’s Library.”↩︎
“Early Modern Annotated Books” (University of California Los Angeles: William Andrews Clark Memorial Library, n.d.), https://calisphere.org/collections/26771/.↩︎
Philip Palmer, “Annotated Books at UCLA: Wider Applications of the AoR Schema Archaeology of Reading,” Archaeology of Reading , September 2018, https://archaeologyofreading.org/annotated-books-at-ucla-wider-applications-of-the-aor-schema/.↩︎
“About the Collections in Calisphere,” Calisphere, accessed August 21, 2023, https://calisphere.org/overview/.↩︎
This is done using Python’s
jsonlibrary, as well as Python’sexiflibrary for .jpg images and thePILlibrary for .png images.↩︎Chien-Yao Wang, Alexey Bochkovskiy, and Hong-Yuan Mark Liao, “YOLOv7: Trainable Bag-of-Freebies Sets New State-of-the-Art for Real-Time Object Detectors,” arXiv Preprint arXiv:2207.02696, 2022, https://doi.org/10.48550/arXiv.2207.02696.↩︎
“Energy Use in Sweden,” Sweden.se, November 2022, https://sweden.se/climate/sustainability/energy-use-in-sweden.↩︎
Alexandre Lacoste et al., “Quantifying the Carbon Emissions of Machine Learning,” arXiv Preprint arXiv:1910.09700, 2019.↩︎
K. A. Manley, “Scottish Circulating and Subscription Libraries as Community Libraries,” Library History 19 (July 2013): 191, https://doi.org/10.1179/lib.2003.19.3.185.↩︎
Printed by J. & M. Robertson, A Wedding-Ring, Fit for the Finger, 1799, National Library of Scotland, http://digital.nls.uk/104185291.↩︎
Printed by T. Johnston for Robert Gregon a young man nearly blind, A Sinner Reclaimed, 1814, National Library of Scotland, http://digital.nls.uk/104185116.↩︎
Printed by D. Macarter & Sons, Ayr, The History of Duncan Campbell, and his dog Oscar, ca. 1817, National Library of Scotland, http://digital.nls.uk/104184176.↩︎
Edmund Weaver, Wigmaker’s Account Book. (London: A. Parker for the Company of Stationers, 1737), https://calisphere.org/item/ark:/21198/n14s4d/.↩︎
Sherman, Used Books, xvii.↩︎
Seth Lerer, “Devotion and Defacement: Reading Children’s Marginalia,” Representations 118, no. 1 (2012): 135, https://doi.org/10.1525/rep.2012.118.1.126.↩︎